 1
 2
 3
 4
 5
 6
 7
 8
 9
10
11
12
13
14
15
16
17
18
19
20
|
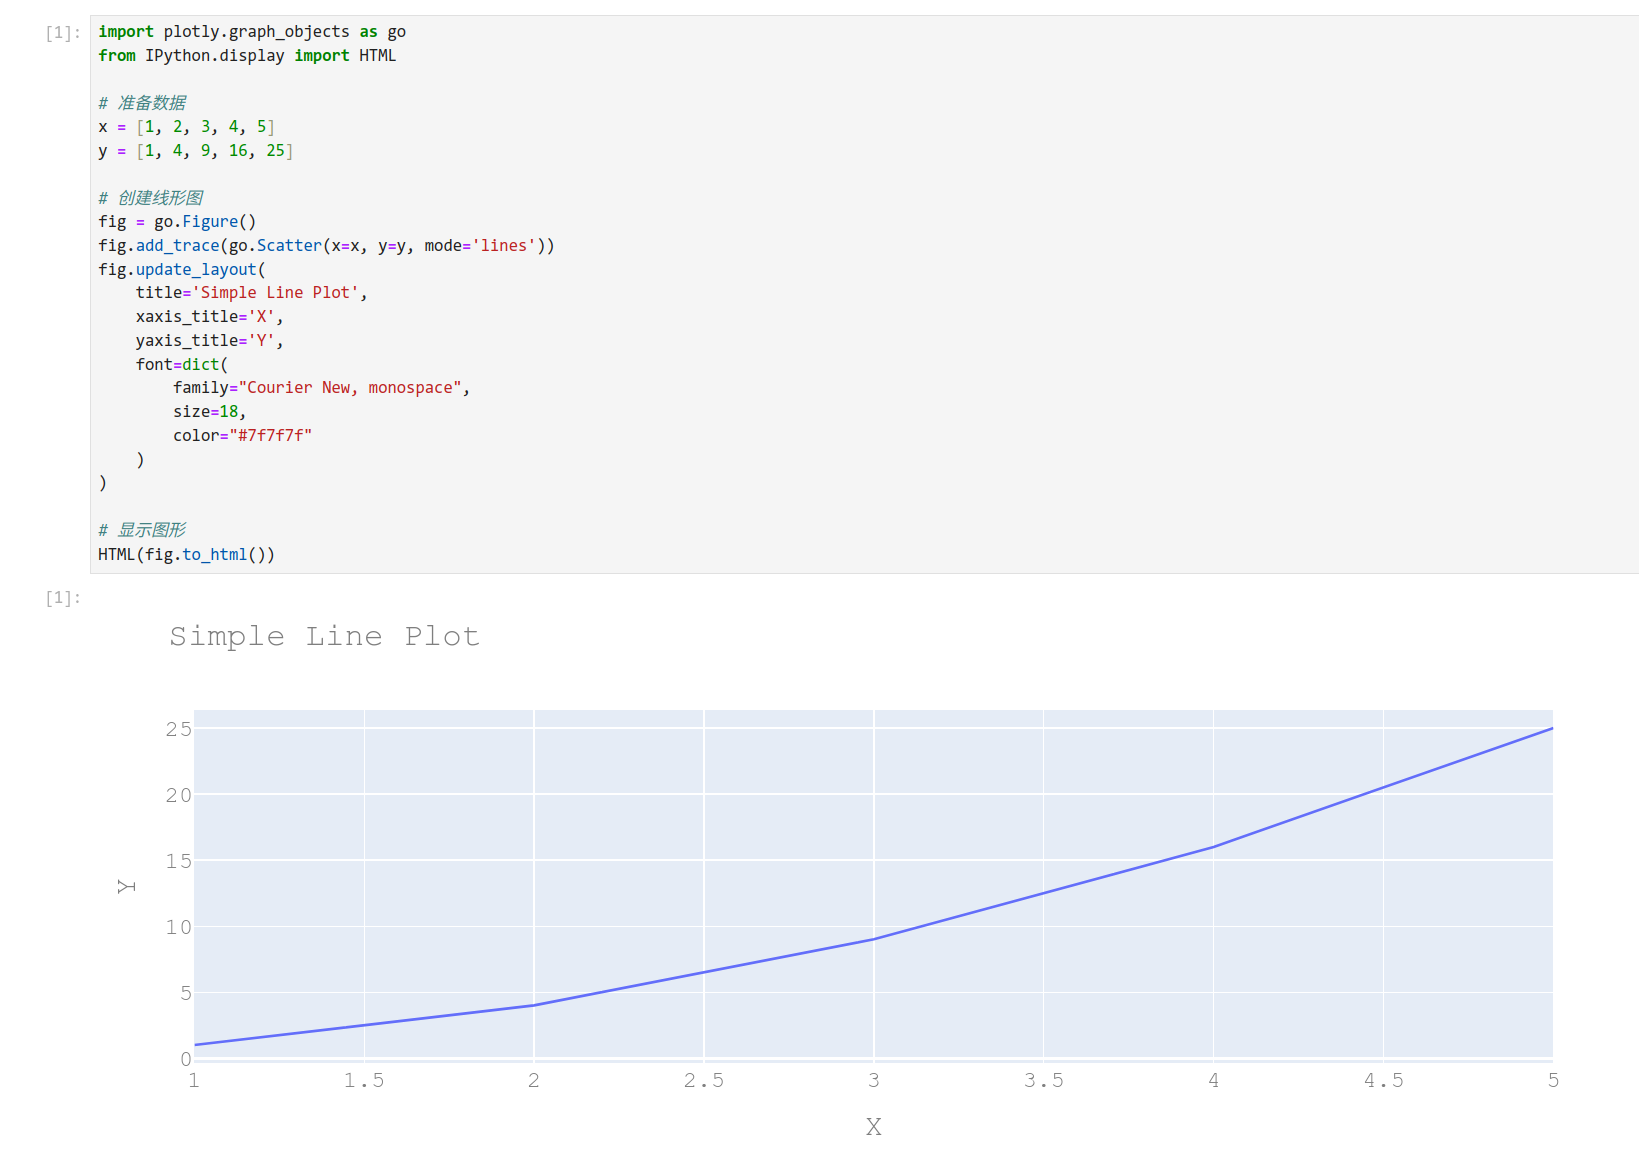
  from IPython.display import HTML
  import plotly.graph_objects as go

  # 准备数据
  x = [1, 2, 3, 4, 5]
  y = [1, 4, 9, 16, 25]

  # 创建线形图
  fig = go.Figure()
  fig.add_trace(go.Scatter(x=x, y=y, mode="lines"))
  fig.update_layout(
      title="Simple Line Plot",
      xaxis_title="X",
      yaxis_title="Y",
      font=dict(family="Courier New, monospace", size=18, color="#7f7f7f"),
  )


  # 显示图形
  HTML(fig.to_html())
|

